From ICE to MICE: A New Dimension in Product Prioritization
How to Unlock Better Priority Alignment, Building Transparency and Trust with Leadership and Stakeholders
Have you ever wondered how top product managers consistently prioritize the opportunities that result in remarkable outcomes? Are you tired of opinionated and political priority discussions with stakeholders? Have you struggled to prioritize ideas with very different expected results (i.e., more revenue vs. cost saving)?
Then read on. This how-to article may give you some answers.
Prioritization basics: Focus on Opportunities
This article is not yet-another-list of prioritization frameworks. So, let’s briefly clarify the starting point so we can move to the crux of the issue.
One of the most (if not THE most) critical tasks in product management, is figuring out and prioritizing what we should build next. Making the right decisions can be the difference between creating a solution that customers love and watching it fade into obscurity.
So naturally, a lot has been said about it, including a lot of nonsense.
One of the most essential starting points to becoming a stronger PM, is focusing on having a more strategic prioritization. Or, as Teresa Torres describes, prioritize opportunities, not solutions.
If you are still doing big spreadsheets with calculations on tons of features and other backlog items, your first move is to get rid of it, move up one level, and start comparing opportunities.
Assessing Opportunities
Once you are at the opportunity level, you will try to do some assessment, to better define the problems to solve and to understand the potential size and impact it can have as new value for the user and the business.
There are many ways to do it:
Marty Cagan describes how to do it by answering critical questions in chapter 35 of Inspired
You can use Dan Olsen’s “2x2 Importance of Need / Current Satisfaction” matrix described in The Lean Product Playbook
Or you can use scoring methods like ICE and RICE (I would recommend Itamar Gilad’s article to start using it)
Or any assessment that works for you.
For clarity, I will continue this article based on ICE scoring, but you can quickly draw the lines to adapt the concepts to your favorite method.
Common Pitfalls
I have used these methods with several teams in different companies, industries, and products, and I typically find similar problems to address.
Making the impact too abstract: When doing prioritization formulas, we create an impact score, and usually, given the uncertainty about it, we start playing with an abstract scale from 0 to 5 or 10. But this is very hard to explain and agree upon with the rest of the organization. “Why 3 and not 4?” “Why is this one a 1 and this other one a 3?” The values may seem arbitrary, and trust in the score is lost rapidly.
Trying to compare impact among very different value types: The second big issue is that we try to encapsulate any kind of value under one single “Impact”. So if it is a “moderate impact opportunity,” we score it a 3, regardless of the value being more revenue or cost efficiencies. Once more, this makes the conversation too abstract, and people would have a hard time understanding and aligning on it. Not to mention that it can hide the importance that one or the other may have for the organization.
Not considering the level of confidence: The final problem is when we are working with “informed guesses,” but fail to express that we don’t have evidence for these estimations. Then when someone doesn’t believe our impact estimation, we start a fight (usually because this other person has their own opinionated priority), instead of stepping back and thinking about the experiment that will give us the data and confidence we need to make a good decision.
At the core of all these issues is a lack of transparency, which usually leads to a lack of alignment.
Imagine discussing priorities with leaders, stakeholders, and peers. You are arguing in favor of one opportunity, and someone suddenly asks: Why do you prioritize that over this one? There is a lack of alignment on:
The things you are considering valuable (revenue, conversion, costs, etc).
The facts you are using to estimate that value.
The hypothesis that you made based on those facts.
Let’s see how to create better alignment on those dimensions, and start a journey of better, less opinionated, decisions.
Quick note: At the other end of the spectrum are teams that revert to a super-detailed analysis, falling to the fallacy that the more complex the model, the more precise it will be. We need to embrace uncertainty. This is not a perfect science; it is a door to better alignment conversations and transparency about our assumptions.
Creating Better Alignment with MICE
I use the term MICE to describe a small adaptation of ICE where we consider multiple impact dimensions.
Let’s say your e-commerce team has to focus on two metrics: increasing the total revenues generated and reducing the number of calls to the service center related to purchase-related problems.
These objectives are very different, and the opportunities you would pursue to achieve them are really hard to compare. How would a 5% increase in conversion rate compare to a 10% reduction in service center calls?
With MICE, we split the impact into more than one dimension to score them independently. Let’s see how to put it into practice.
Note: This example is a bit extreme, and hopefully, you don’t have a team focusing on such unrelated topics. But I have seen enough to know this is not such a rare case.
3 Steps to Use MICE
Let me start by recognizing that this sounds like the very problem I was trying to prevent: trying to make complex formulas that look precise, give us confidence, and make us hide lousy decision-making under a formula.
While it can be misused, the goal is the opposite: discuss the critical key levers and make the impact hypothesis visible for discussion. Let’s see how to do it.
1. Align on dimensions
The first stage is discussing what we will consider impact.
First, try to align on really few (2 or 3) top metrics, rather than multiple sub-metrics. Following the e-commerce example, we prefer Total Revenue versus the sub-metrics Conversion Rate (CR) and Average Order Value (AOV). The reason is simple: if you have an opportunity that impacts CR, you can easily use the estimated impact to calculate the effect on total revenue. Doing the same for an opportunity that hits AOV allows you to compare the two, without needing to increase complexity in the method.
Second, if needed, align on what is most important. For example, if you are in a growth period, it may be more important to maximize revenue. On one extreme this could even allow you to directly drop a dimension. While teams fear this, is an excellent outcome of a conversation with leaders or stakeholders because they are signaling clear focus for the team. A softer version is changin the weight of a dimension (for example, instead of having two dimensions at 50/50 weight each, you may go for a 75/25 if one is more important at the moment). Remember, it’s not about complex and precise formulas, is about making prioritization thinking transparent and equally accesible.
2. Align on ranges
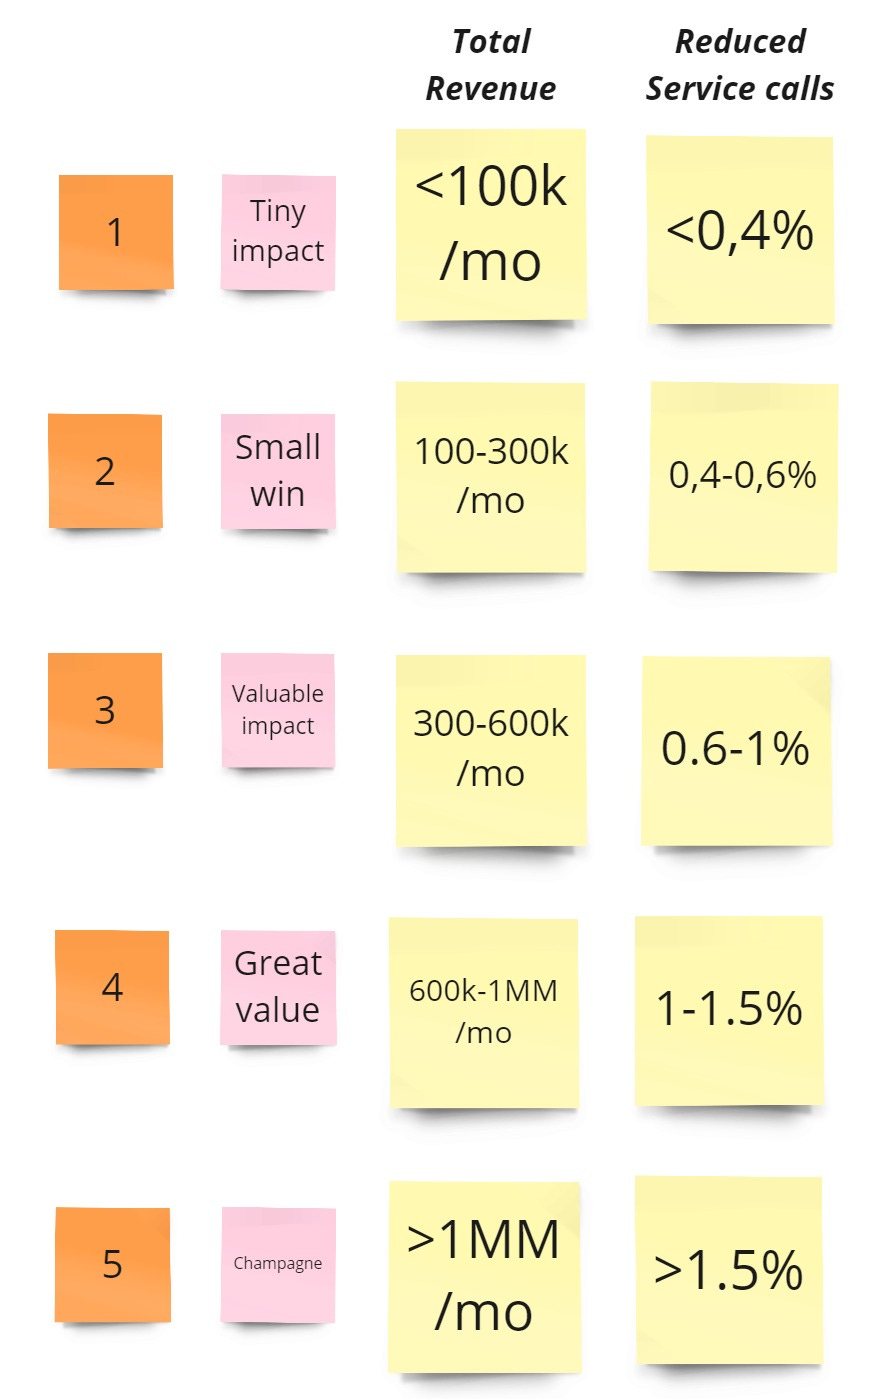
The second step is aligning on what each value of the dimension means. In abstract terms, each level should represent higher value:
is a Tiny impact
Small win
Considerable Impact
Great value
We nailed it, let’s open the champagne!
But of course, that’s very opinionated, and not very useful for stakeholder conversations or to more robustly compare initiatives.
So based on the metric we selected, we assign a range to each level. For example, for revenue, we can say a 1 is anything that adds up to $100k per month. A 2 is for opportunities that range from $100k to $300k. And up we go.
How to come up with this numbers? I usually recommend looking at past opportunities. If you can’t estimate future ones, and see if you can find the smallest and biggest one to build your scale around those.
Do this exercise for each dimension you selected:
This values should also be aligned with leadership and stakeholders. At the end of the day, we want to have better discussions with them, and the best way to achieve that is co-creating the model.
Note: If you use only one impact dimension (aka ICE), you should still do the range!
3. Test and refine
The final step is using upcoming opportunities to test your parameters.
How we do that? We make an hypothesis of impact, given the facts we have, and use the value of the hypothesis to map the appropriate level.
Let’s see an example: our e-commerce team wants to solve a problem with the clarity of T-shirt size selection. 20% of users search for T-shirts, it accounts for 10% of their revenues, and their current conversion rate is 2%.
They estimate that they can increase conversion to 3%, and estimate this 50% increase in conversion rate to add 50% more revenues for this product. And since it accounts for 10% of sales, it would mean a 5% in total revenues, a +700k increase which is a 4 in their scale.
When testing a few opportunities with the model, we want to review a few things:
Are the ranges working? If everything is a 1 or a 5, then probably you need to move the scale.
Can we make hypothesis for the defined dimensions? For example, if we select market share, or even NPS, it could be a laggard indicator affected by too many variables, making it very hard to score new bets.
Do the resulting priorities make sense? After a few opportunities, we can check if the values we are seeing out of the model resonate or are incoherent.
Note that we are not discussing confidence or ease in this article, the other big components of the MICE score.
Conclusion
That’s it! You are ready to test MICE.
But every method has its tradeoffs.
I will say it one more time: it can make you fall into the “more complexity is more precise” fallacy. We don’t want to over-engineer methods that are per-se unprecise estimations.
It can also encourage or disguise a problem of lack of focus and strategy. This method can help teams that work in multiple directions, but that is an antipattern that we want to avoid.
But if you avoid this pitfalls, it can truly unlock better opportunity priority alignment.


