

Combining Scoring (RICE, ICE, etc) and Assumption Mapping
Clarifying the reasoning behind your assessment and level of confidence - with an end-to-end example :)

Hey! Nacho here. Welcome to Product Direction’s newsletter. If you’re not a subscriber, here’s what you missed:
Subscribe to get access to these posts, and all future posts.
Teams embarking on opportunity exploration and mapping often use some form of scoring (like ICE or RICE) to evaluate and do high-level prioritization of the topics they may focus on and make further discovery efforts.
At its core, these frameworks ask you to put numbers to at least:
Expected Impact
Confidence
Effort (or its opposite “easiness” in the case of ICE)
Even the more straightforward “Impact / Effort” matrix has the same logic (shying away from scoring the evidence and certainty as in its more elaborated counterparts).
How do teams score, and why is it problematic? (with an example)
So, we quickly jump to do estimations based on whatever information we have.
We can combine user behavior analytics tools with insights from interviews and benchmark analysis and add our findings to produce a number we can share and reasonably explain.
Even if we don’t have that much data, we can still produce a number and use a low confidence score.
This is great! It is how it’s supposed to be done!
What’s the problem then? We are not making explicit the assumptions that led to this value.
As we will see later, the score is not the problem! It’s how this leads to opaque opinion-based discussions.
Let’s see an example
Imagine you are a ticket-tracking tool, much like JIRA, and you want to evaluate an opportunity to provide managers with automated AI-based reports of bottlenecks in their projects.
Your overall desired outcome is to reduce churn. You bet that by improving reporting, managers will increase usage and satisfaction, thus reducing their likelihood of churn.
So you go ahead and use some data points to estimate impact:
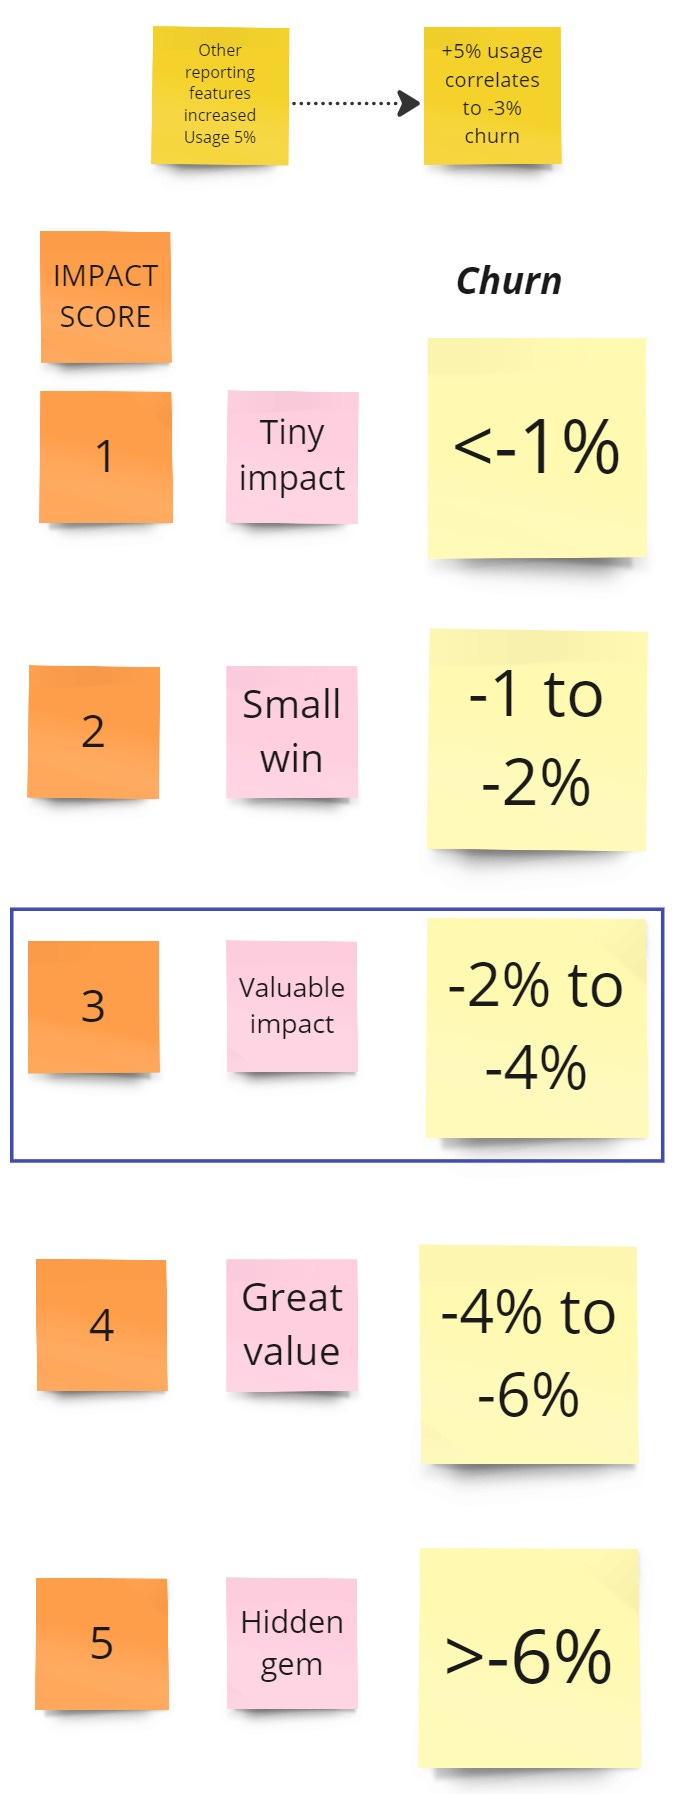
Based on previous reporting features, you estimate managers will increase usage by 5%.
There is a correlation between more usage and reduced churn. You correlate the 5% increase to a 3% decrease in churn.
In your ICE model, a 3% decrease in churn corresponds to a score of 3 for Impact.
Moving on to evaluating confidence, I like using Itamar Gilad’s confidence meter to put concrete values to our evidence.
Since we only have back-of-the-envelope estimations, our confidence score is very low, 0.3 to be precise, using Itamar’s scale.
We know we need to increase confidence, so we go ahead and do a fake door test, which results positive with a 10% CTR, increasing our confidence to a solid 2.3.
Fast-forward to the quarterly planning meeting, you included the idea for next quarter and are showing your plan to stakeholders. But… the COO jumps in and challenges that he believes a 3% decrease in churn with a report is too pretentious, and he pushes to prioritize a “change in how dependencies are tracked” that has been a frequent client complaint, and -gasp- your key competitor has it.
Now it’s your turn to disbelieve his claim, and the opinions debate starts…
Mapping Assumptions Before Jumping to Conclusions
Assumption mapping, as presented in Testing Business Ideas, is an exercise to understand and visualize the assumptions you have to believe the idea could work, grouping them in desirability, viability, and feasibility.
You then rank them according to importance (how critical it is to the idea's success) and how much information you have about it (close to our above-mentioned confidence evaluation).
Continuing with our example and more calmly considering our COO’s feedback, we must admit there is a good point: even when we tested interest, we didn’t really have evidence on how it would impact churn.
Instead of jumping to scoring, this time, we can map assumptions, and we uncover the following high-impact, low-evidence ones:
Managers will be interested in seeing bottlenecks [Value]
Managers will come back regularly to see bottlenecks, driving engagement and reducing churn [Viable]
We can successfully identify bottlenecks with AI [Feasible]
The way we show bottlenecks will be useful and actionable for managers [Value]
Fake doors are demand experiments: we only tackle the first assumption, interest.
This is very valuable, and we must do it! If there is no demand, everything else in our idea falls apart.
But it is not enough.
Our stakeholder is concerned about the viability of our idea: will managers come back regularly to see the report and thus reduce churn?
His idea, on the other hand, also has an assumption! Dependency tracking is something that teams must do regularly, so there may be an increase in engagement and churn reduction if we solve it.
Combining Scoring and Assumption Mapping
Now, we can go back to the scoring exercise and combine it with a better understanding of the risky assumptions.
What assumptions must be valid to make this idea a “3” in impact?
Managers will be interested in seeing bottlenecks [Value]
Managers will come back regularly to see bottlenecks, driving engagement and reducing churn [Viable]
The way we show bottlenecks will be useful and actionable for managers [Value]
Even with a fake door, we cannot say we have “Mid-Low” confidence because we still have a lot of uncertainty in the other variables.
Returning to the conversation with our COO, we can now say that “we believe in this idea due to some evidence but still have high uncertainty.”
Similarly, when taking their idea, you can explore the assumptions and discuss what evidence we have for each of those and what you need to experiment with.
It’s not about scoring!
As you may have noticed from the last part, nothing here is about better scoring.
It’s all about better conversations!
Combining these two tools aims to unlock a conversation with stakeholders, being more open and transparent about what we know.
Remember that these discussions help you have more input on your blindspots, bring you different evidence you may not have access to, and finally help you prioritize your discovery and understand what is critical to validate for different players in the organization.